- Computer Fundamentals Course
- Computer Fundamentals Tutorial
- Block Diagram of a Computer
- The Generation of Computers
- Types of Computers
- Classification of Computers
- Characteristics of Computers
- Applications of Computers
- Central Processing Unit
- Input Devices
- Output Devices
- Computer Memory and Types
- CD, HD, Floppy, and PenDrive
- Types of Computer Languages
- Types and Language Translator
- Number System with Types
- Decimal to Binary
- Decimal to Octal
- Decimal to Hexadecimal
- Binary to Decimal
- Binary to Octal
- Binary to Hexadecimal
- Octal to Decimal
- Octal to Binary
- Octal to Hexadecimal
- Hexadecimal to Decimal
- Hexadecimal to Binary
- Hexadecimal to Octal
- Algorithm and Flowchart
- Selection Sort
- Insertion Sort
- Bubble Sort
- Linear Search
- Binary Search
- Bitwise Operators
- Binary Number Addition
- EBCDIC & ASCII Code
- BCD, Excess-3, 2421, Gray Code
- Unicode Characters
Algorithm and Flowchart with Examples
We will study about algorithms and flowcharts with examples in this post or lesson. Let us begin with the algorithm.
Algorithm
An algorithm is a step-by-step description of how to solve any given problem.
Alternately, one could say that the algorithm of every given program is a step-by-step solution description of the problem or program that has been presented.
In order to be considered an algorithm, a sequence of instructions must have the following characteristics:
- Each and every one of the written instructions ought to be clear and unmistakable.
- Each instruction should be carried out at a predetermined interval.
- There should not be an unlimited amount of instructions that are repeated.
- The intended end result must be achieved after carrying out all of the steps outlined in the instructions.
Example of an Algorithm
Let's look at an algorithm example and see how we can write an algorithm for a given problem.
Create an algorithm for calculating the sum of the first N numbers
In this case, we must develop an algorithm or a step-by-step solution description for calculating the sum of the first N numbers. So, what are we still waiting for? Let us now create an algorithm to address this problem.
1. Read the value of n
2. Put i=1, sum=0
3. if(i>n), go to step 7
4. Update s = s + i
5. Update i = i+1
6. go to step 3
7. Print the value of s
8. Stop
As you can see from the preceding algorithm, which is presented in eight steps, it assists you in creating a program to find the sum of the first N numbers.
Create an algorithm to determine the least and biggest number from a given set of numbers
In this case, we must create an algorithm that will assist us in determining the smallest and largest number from a given list of integers.
1. Read the entire list of numbers
2. Assign the first number as the largest number
3. Assign the first number as the smallest number
4. Repeat steps 5 through 7 as long as the largest and smallest numbers are there
5. Read the number and compare the largest and smallest values
6. If the number is greater than the largest, then the current number is the largest.
7. If the number is less than the smallest, then the current number is the smallest.
8. Print the largest number
9. Print the smallest number
10. Stop
You can now easily apply all of the above stages to create a program that finds the largest and smallest number from a given list of integers.
Flow Chart
A flow chart is the pictorial representation of any given task, problem, or program.
Types of Flow Chart
There are two types of flow charts, given here with their short descriptions:
- System Flow Charts: These flowcharts describe the logical flow of the process, which is actually the sequence of events in business that happen before something is achieved.
- Program Flow Charts: This is a flowchart of a single program in high-level language. This type of flow chart has the file names used for input, output, updating the files accessed, and the names of any reports that might be created after the program runs. It means that program flow charts contain each and every single detail of the program.
Advantages of Flow Charts
Here are a few of the most important reasons why you should use flow charts before applying any solution to a program:
- Effective Analysis: Using a flow chart, any problem can be analyzed in a more effective way.
- Communication: Flowcharts are a much better way of communicating the logic of a system to all parties concerned.
- Efficient Coding: Every flowchart acts as a guide or blueprint during the systems analysis and program development phases.
- Proper Debugging: The flowcharts help in the debugging process.
- Efficient Program Maintenance: The maintenance of operating programs becomes very easy using flowcharts.
- Proper Documentation: Program flowcharts serve as good program documentation, which is needed for various purposes.
Disadvantages of Flow Charts
Here is a list of some primary or main disadvantages of using flowcharts for any given problem:
- Complex logic: Sometimes the given program logic is quite complicated. In that case, it becomes a very difficult task to design or draw a flowchart for that problem or program. In that case, algorithms help a lot.
- Alterations and modifications: If we want to alter or change any logic of the program in the flowchart, then we have to re-draw the whole flowchart, which is very irritating.
Basic Symbols used in Flow Chart
Standardization of these fundamental flow chart symbols has been completed by the American National Standard Institute (ANSI).
Terminal
In order to denote the beginning and the conclusion of the program, the terminal symbol is utilized. The following is the sign for the terminal:

Input/Output
The input and output of an operation are typically represented as two sides of a parallelogram. The following is a demonstration of an input/output symbol that may be used in a flowchart:

Processing Symbol
The rectangle symbol is required to be used whenever there is a need to denote a processing operation in a flowchart. The following is a demonstration of the symbol for the rectangle that is used in creating flowcharts to represent activities involving storage or arithmetic:

Decision Symbol
It is necessary to make use of a box in the shape of a diamond in order to denote the stage of the decision-making process. This is the demonstration symbol for a box in the shape of a diamond:

Flow of Lines
A program's logic flow can be analyzed by tracing the path taken by the lines of code. It is necessary to draw lines in the spaces between each box on the flowchart to show the direction in which the program will proceed. The example of the line flow symbol is as follows:

Connector Symbol
When connecting the various components of a flowchart, we need to draw a circle. The demo symbol for a circle that is used in a flowchart looks like this:

Example of a Flowchart
Let's look at a flowchart example to understand how to use all of the symbols described above to build a visual representation that describes the solution to any program or problem.
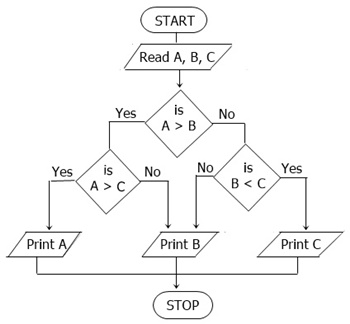
Create a flowchart to determine the greatest of three numbers
The flowchart shown in the figure below assists in determining the greatest of the three numbers:

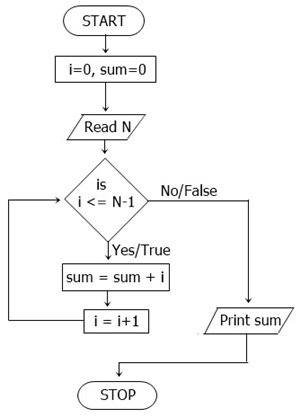
Make a flowchart that computes the sum of the first N numbers
Another flowchart for calculating the sum of the first N natural numbers is shown below:

« Previous Tutorial Next Tutorial »